Trace impurity testing identifies, isolates, and measures unwanted substances in materials like drugs, food, and electronics. Even at levels as low as 0.05%, impurities can pose serious risks, such as toxicity or carcinogenicity. Industries rely on techniques like HPLC for non-volatile compounds, GC for volatile impurities, and LC-MS/MS for structural identification at extremely low concentrations. However, challenges include:
- Signal-to-Noise Limitations: Low impurity levels can blend into baseline noise, requiring precise detector optimization.
- Coelution Issues: Overlapping peaks can obscure impurities, demanding effective chromatographic separation.
- Matrix Interference: Complex sample components can mask or distort impurity signals, necessitating robust sample preparation.
- Retention-Time Shifts: Variations in pH, temperature, or mobile phase composition can affect impurity detection.
- Reproducibility: Ensuring consistent results across instruments and conditions requires method validation.
Addressing these issues involves fine-tuning detection methods, maintaining equipment, and using high-purity raw materials to improve accuracy and reliability. Trace impurity testing is critical for regulatory compliance in pharmaceuticals, food, and other industries.
Challenges in Low-Level Impurity Detection
Signal-to-Noise Limitations
Detecting trace impurities isn’t just about having advanced instruments – it hinges on effectively managing the signal-to-noise (S/N) ratio. This ratio compares the height of an analyte’s peak to the background noise on the baseline. When impurity levels are extremely low, their peaks can easily blend into the noise. According to ICH Q2(R2) guidelines, a minimum S/N ratio of 2:1 or 3:1 is required for detection, while 10:1 is needed for quantitation [5].
Several factors can degrade the S/N ratio. For instance, mobile phase contamination – such as impurities introduced by new eluent suppliers – can increase baseline noise. Hardware issues like air bubbles, dirty guard columns, or insufficient degassing of mobile phases also contribute to this problem. Even the choice of solvent plays a role. Methanol, for example, has a high UV absorbance near 200 nm, which can obscure the detection of small impurity peaks. To achieve better sensitivity, optimizing detector settings is critical.
Detector Sensitivity Optimization
Enhancing detector sensitivity requires boosting the analyte signal while minimizing baseline noise. One effective adjustment is fine-tuning the detection wavelength. Many compounds have a secondary UV absorbance maximum around 254 nm, where baseline noise tends to be lower compared to 200 nm. When low-wavelength detection is unavoidable, switching from methanol to acetonitrile can help reduce background absorbance. Using narrower-bore columns can also concentrate analyte peaks, though this may increase noise. Additionally, the sampling frequency must align with the flow rate to accurately capture narrow peaks. Adjustments to sample preparation can further refine detection performance.
Methods for Improving Detection Sensitivity
Several strategies on the sample side can significantly improve detection sensitivity. Increasing the injection volume deposits more analyte onto the column, resulting in taller peaks – provided resolution isn’t compromised. Pre-concentration techniques, such as solid-phase extraction, can enrich trace impurities from dilute samples before injection.
Routine system maintenance is equally important for consistent sensitivity. Replacing the guard column at the first sign of increased noise – or even evaluating the separation column if necessary – can help isolate potential issues. Filtering and thoroughly degassing aqueous mobile phases can prevent baseline instability, which might otherwise mask low-level peaks. Another option is baseline subtraction, which removes consistent background noise by subtracting a blank run. However, this approach may require regulatory approval.
sbb-itb-aa4586a
Coelution and Separation of Similar Impurities
How Retention-Time Shifts Affect Impurity Detection
Separating closely related impurities requires more than just high detector sensitivity – it demands effective chromatographic separation. Even with optimized sensitivity, structurally similar impurities can go unnoticed due to coelution, where overlapping peaks make it difficult to distinguish individual compounds. This issue often arises because similar compounds, such as a drug and its by-product, share comparable polarities. Small changes in pH (±0.2 units) or mobile phase composition (±2%) can cause these peaks to merge. Retention-time (RT) shifts, which may decrease, increase, or fluctuate, are influenced by factors like temperature changes, pump inconsistencies, or inadequate column equilibration.
Coelution doesn’t just obscure impurities – it can also lead to incorrect impurity quantification, creating compliance risks in regulated industries. Studies show that about 15% of drug formulations exceed acceptable impurity limits [1]. To reduce RT shifts, consider these strategies:
- Use a column thermostat to maintain consistent temperatures.
- Prepare mobile phases freshly and keep solvent reservoirs covered to prevent evaporation.
- Allow sufficient column equilibration – typically 10 to 15 column volumes for isocratic methods.
- Maintain buffer concentrations between 20 mM and 50 mM to stabilize pH and reduce RT drift [6].
By addressing RT shifts, you can ensure more accurate impurity quantification and better regulatory compliance.
Improving Chromatographic Resolution
When RT shifts make separation challenging, reevaluating column selection can often yield immediate improvements. Columns like core-shell or monolithic types offer higher efficiency compared to traditional fully porous particles, providing better separation for similar compounds. Using UHPLC (Ultra-High-Performance Liquid Chromatography) can also enhance resolution by employing smaller particle sizes and higher operating pressures, achieving superior separation in less time.
Adjusting the mobile phase is another effective approach. Modifying pH or buffer concentration can shift impurity retention times, while employing a shallower gradient profile gives compounds more time to interact with the stationary phase, improving separation. Additionally, systematically adjusting column temperature in increments of ±5°F can help fine-tune selectivity for specific compounds.
If chromatographic methods alone don’t resolve the issue, orthogonal detection techniques can provide additional insights. For example:
- Diode Array Detection (DAD): This technique evaluates spectral consistency across a peak to identify hidden coelution.
- LC-MS (Liquid Chromatography–Mass Spectrometry): This method distinguishes overlapping compounds by their mass-to-charge ratios, even when they share the same retention time.
Regular System Suitability Testing (SST) is also essential. By monitoring resolution between critical pairs, SST ensures the system is ready to detect trace impurities accurately and maintain compliance with regulatory standards.
Handling Complex Sample Matrices
How Sample Matrices Affect Impurity Detection
After optimizing chromatographic separation, managing matrix complexity becomes essential for precise impurity detection.
Even with ideal separation, the components within a sample matrix can obstruct impurity identification. Pharmaceutical formulations, for example, often include excipients, active pharmaceutical ingredients (APIs), residual solvents, and synthesis by-products – all of which share the same environment as the trace impurities you’re trying to detect. These components can interfere with the accuracy of your analysis.
One common issue is signal masking, where high-concentration components overlap with the signals of trace impurities. In LC-MS applications, co-eluting matrix components may cause ion suppression or enhancement, leading to inaccurate quantification. Additionally, residual matrix components can elevate baseline noise and raise the limit of detection (LOD), making it more challenging to distinguish trace peaks from background chemical noise.
Other challenges include retention time shifts caused by matrix components, which complicate peak identification over time, and column fouling from non-volatile materials like proteins or lipids. Fouling increases backpressure, reduces resolution, and shortens the lifespan of the column. Regular blank injections are crucial to detect ghost peaks, which are artifacts introduced by the matrix or sample preparation reagents and can be mistaken for real impurities.
Sample Preparation Techniques
Effective sample preparation is a key step in minimizing matrix interference and ensuring reliable signal detection. The choice of preparation method depends on the sample’s complexity and the sensitivity required.
| Technique | Primary Function | Key Trade-off |
|---|---|---|
| Filtration | Removes particulates to prevent column clogging | Quick and cost-effective, but does not address dissolved interferences |
| Solid-Phase Extraction (SPE) | Concentrates trace impurities while eliminating bulk matrix | Highly selective but requires method development and is more expensive per sample |
| Liquid-Liquid Extraction (LLE) | Separates analytes based on polarity using immiscible solvents | High capacity but labor-intensive and uses large amounts of solvent |
| Protein Precipitation | Quickly removes bulk proteins in biological samples | Fast but may leave behind lipids that contribute to ion suppression |
A "dilute and shoot" method can reduce matrix interference if the detector’s sensitivity is adequate. When matrix effects cannot be fully eliminated, matrix-matched calibration – creating calibration standards in a blank matrix similar to the sample – helps compensate for signal distortion. For LC-MS specifically, stable isotope-labeled internal standards (SIL-IS) provide a highly reliable correction method. These standards co-elute with the target analyte and experience the same matrix effects, ensuring more accurate quantification [8][9].
Using a guard column is another simple yet effective step. It captures strongly retained contaminants from the matrix before they reach the main analytical column, extending the column’s lifespan and helping maintain consistent results.
"The ME is a direct or indirect alteration or interference in response because of the presence of unintended analytes (for analysis) or other interfering substances in the sample." – US Food and Drug Administration [7]
Drug impurities? Is your HPLC method up to standard?
Reproducibility and Method Validation
Trace Impurity Testing: Method Validation Parameters & Acceptance Criteria
After managing matrix interferences, the next challenge is ensuring validated reproducibility. This involves rigorous testing to confirm consistent results across different analysts, instruments, and laboratories. Addressing issues like matrix effects and coelution underscores the importance of strict validation processes.
Key Method Validation Parameters
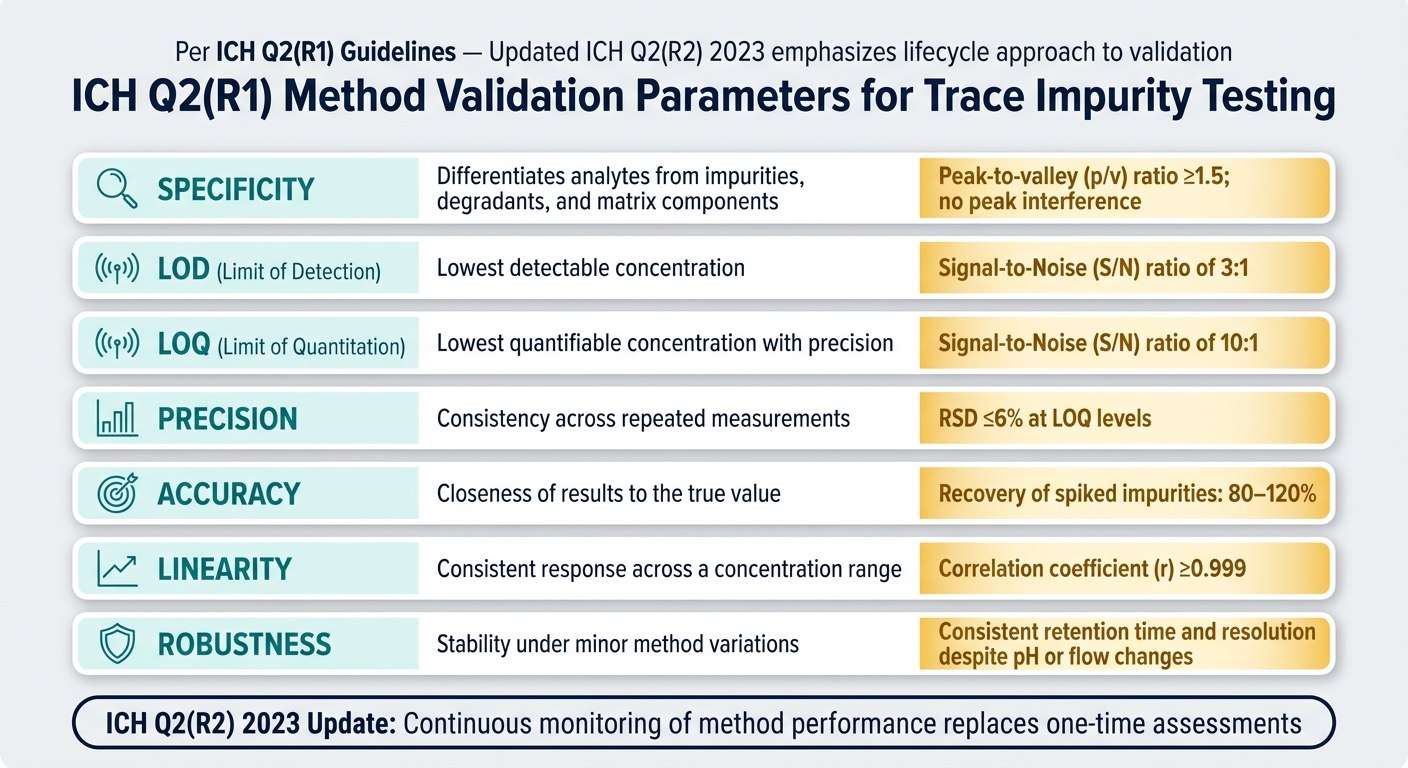
Method validation ensures that a testing method performs as intended. According to ICH Q2(R1) guidelines, the primary parameters for trace impurity testing include specificity, accuracy, precision, linearity, limit of detection (LOD), limit of quantitation (LOQ), and robustness [2].
Specificity is one of the most challenging aspects to validate. It requires proving that the method can differentiate target impurities from APIs, excipients, and degradants. This is achieved through forced degradation (or stress testing), where the API is exposed to heat, light, oxidation, and extreme pH conditions to produce degradants. For results to be meaningful, API degradation should exceed 0.5% to allow impurity growth to be observed. However, it should remain below 2% for oxidative or photodegradation stress and below 5% for other conditions to avoid triggering secondary reactions [10].
LOQ and LOD are critical for trace impurity testing. LOQ is defined by a signal-to-noise (S/N) ratio of 10:1, while LOD uses a threshold of 3:1 [10][2]. These thresholds establish the minimum levels at which impurities can be reliably detected and quantified.
Beyond setting these parameters, ensuring consistent reproducibility across tests is key to maintaining method reliability.
Maintaining Reproducibility Across Tests
Reproducibility becomes particularly challenging when impurity peaks overlap closely. To address this, specific acceptance criteria for peak-to-valley (p/v) ratios, relative standard deviation (RSD), and S/N thresholds are applied. These criteria ensure that even closely eluting peaks are resolved accurately.
Robustness testing is another essential step. By varying conditions like pH, flow rate, and column temperature during validation, you can confirm the method’s reliability under minor fluctuations [11]. The 2023 update to ICH Q2(R2) emphasizes a lifecycle approach to validation, moving away from one-time assessments and toward continuous monitoring of method performance [11].
Validation Parameters: Comparison Table
| Validation Parameter | Purpose in Trace Impurity Testing | Key Acceptance Criteria |
|---|---|---|
| Specificity | Differentiates analytes from impurities, degradants, and matrix components | p/v ratio ≥1.5; no peak interference [10] |
| LOD | Lowest detectable concentration | S/N ratio of 3:1 [2] |
| LOQ | Lowest quantifiable concentration with precision | S/N ratio of 10:1 [10] |
| Precision | Consistency across repeated measurements (repeatability/intermediate precision) | RSD ≤6% at LOQ levels [10] |
| Accuracy | Closeness of results to the true value | Recovery of spiked impurities, typically 80–120% [2] |
| Linearity | Consistent response across a concentration range | Correlation coefficient (r) ≥0.999 |
| Robustness | Stability under minor method variations | Consistent retention time and resolution despite pH or flow changes [2] |
Troubleshooting and Optimizing Chromatographic Methods
This section provides practical solutions for common chromatographic challenges, focusing on identifying and addressing issues efficiently to maintain method reliability.
Real-world chromatographic runs often face performance hiccups. Pinpointing the root cause before making any adjustments can save time and prevent additional complications.
Common Chromatography Problems and Their Causes
Several recurring issues in chromatography can disrupt trace impurity testing:
- Poor peak resolution: This is often linked to an inappropriate mobile phase composition, incorrect pH levels, or a column that is either too short or has particles that are too large for the required separation.
- Peak tailing: This typically indicates column degradation or sample overloading caused by injecting excessive volumes.
- Baseline noise or fluctuations: These are usually due to dissolved gases in the mobile phase, system leaks, or an aging detector lamp, all of which can hinder trace-level detection.
- Retention time drift: Causes include temperature variations, mobile phase evaporation, or insufficient column equilibration.
- Ghost peaks: These unexpected peaks often arise from contamination in the injector or column, or from impurities in the mobile phase.
Tips for Optimizing Chromatographic Performance
To ensure consistent and reliable chromatographic results, consider the following strategies:
- Control temperature: Even minor changes in room temperature can affect mobile phase viscosity and analyte interactions, leading to retention time shifts. A column oven can maintain a stable temperature, minimizing variability.
- Maintain mobile phase quality: Always prepare fresh mobile phases for each batch, and keep reservoirs sealed to prevent evaporation of volatile components. Use HPLC-grade solvents to avoid introducing impurities. Proper equilibration is also key – flush isocratic systems with 10–15 column volumes of the mobile phase before starting, and for gradient methods, use at least 10 column volumes of the initial phase. Ion-pairing chromatography may require up to 50 column volumes.
- Monitor detector performance: Deuterium lamps in UV detectors typically last 1,000–2,000 hours. An aging lamp can increase baseline noise and reduce sensitivity. To check for detector variability, inject 5–6 replicates of a known standard and calculate the relative standard deviation (RSD) of the peak areas. An RSD above 2% suggests issues with the autosampler syringe, needle, or rotor seal.
These steps, combined with the troubleshooting techniques outlined below, can help maintain robust trace impurity testing.
Chromatography Problems and Solutions: Comparison Table
Here’s a quick reference table summarizing common problems, their causes, and recommended fixes:
| Problem | Likely Causes | Recommended Fixes |
|---|---|---|
| Inadequate Resolution | Suboptimal mobile phase; wrong column type; incorrect flow rate | Adjust mobile phase pH/gradient; use a longer column or smaller particle size; optimize flow rate |
| Peak Tailing/Asymmetry | Column degradation; column overloading; sample matrix interference | Replace column; reduce injection volume; optimize sample cleanup |
| Baseline Noise/Fluctuations | Air bubbles in pump; leaks; impure solvents; aging detector lamp | Degas mobile phase; tighten fittings; use HPLC-grade solvents; replace detector lamp |
| Retention Time Drift | Temperature changes; mobile phase evaporation; poor column equilibration | Use a column oven; cap solvent reservoirs; increase equilibration time (10–50 column volumes) |
| Ghost Peaks | Injector or column contamination; impure mobile phase | Flush system and column; use higher-purity reagents; run a blank to identify the source |
| Loss of Sensitivity | Fouled detector cell; aging lamp; incorrect detection wavelength | Clean flow cell; replace lamp; verify wavelength is optimized for the target impurity |
| Inconsistent Peak Areas | Leaky syringe or injector; air in pump head; variable flow rate | Replace rotor seals; prime pump; inspect check valves for debris |
Keeping detailed records of mobile phase composition, column usage, instrument settings, and any deviations can simplify problem-solving and help demonstrate method control during audits.
Trace Impurity Testing in Regulated Industries
Trace impurity testing plays a vital role in ensuring compliance across regulated industries. Whether in pharmaceuticals, food additives, or cosmetics, manufacturers must meet strict regulatory expectations to identify, measure, and manage impurities at extremely low levels.
Regulatory Standards and Compliance Requirements
Guidelines from the International Council for Harmonisation (ICH) set the benchmarks for impurity testing, detailing thresholds for reporting, identification, and safety qualification. For new drug substances, the ICH Q3A(R2) guideline mandates that:
- Impurities at or above 0.05% must be reported.
- Those at or above 0.10% require structural identification.
- Levels at or above 0.15% must undergo safety qualification for drugs with a maximum daily dose of 2 g/day or less [4].
Residual solvents are categorized under ICH Q3C(R8) based on toxicity levels. Class 1 solvents, like benzene, are nearly banned, with a strict limit of 2 ppm. Class 2 solvents, such as acetonitrile and methanol, have defined daily exposure limits, while Class 3 solvents like ethanol are considered safer. For elemental impurities, ICH Q3D(R2) sets oral exposure limits, such as 15 µg/day for arsenic and 5 µg/day for lead. Mutagenic impurities, regulated by ICH M7(R2), have even stricter allowances, with a lifetime exposure intake capped at 1.5 micrograms per day [4].
"The regulatory question is not whether impurities are present – it is whether they are identified, quantified, controlled, and demonstrated to be safe at the levels present." – Dr. Ram Sharma, Founder & CEO, ChemContract [4]
Nitrosamines, a specific impurity class, have heightened the need for advanced analytical tools and stricter raw material oversight. These evolving standards highlight the necessity of precise and tailored impurity testing across industries.
Industry Applications of Trace Impurity Testing
Regulatory mandates shape how impurity testing is integrated into various industries, but the ultimate objective remains the same: safeguarding consumers.
In the pharmaceutical sector, stability-indicating methods must confirm that the active ingredient remains distinct from its degradation products – a principle known as peak purity. Techniques like diode array detection (DAD) and mass spectrometry are essential for resolving overlapping impurities [4]. Early-stage impurity profiling is crucial to prevent delays in regulatory submissions. For instance, structural identification of unknown impurities using high-resolution mass spectrometry (HRMS) and nuclear magnetic resonance (NMR) can take 4 to 12 weeks per compound. Postponing this process until later stages can significantly delay product approval timelines [4].
For food and cosmetic products, elemental impurity testing ensures heavy metals like arsenic or lead are within safe limits. Palladium, often used as a catalyst in synthesis, has an oral permitted daily exposure (PDE) of 100 µg/day. Advanced techniques like inductively coupled plasma mass spectrometry (ICP-MS) verify its removal [4].
"The rigorous identification, quantification, and control of impurities are fundamental to ensuring the safety, efficacy, and quality of pharmaceutical products throughout the drug development lifecycle." – Pharmaceutical Research [3]
How Allan Chemical Corporation Supports Quality Chemical Sourcing

Effective impurity testing begins with high-quality raw materials. Allan Chemical Corporation supports compliance efforts by supplying compendial-grade chemicals, including USP, FCC, ACS, and NF grades, for use in pharmaceuticals, food, cosmetics, and other regulated applications. Impurities can arise from raw materials, synthesis methods, degradation, or storage conditions, and even trace amounts can pose toxicological risks [2]. Starting with purer inputs minimizes contamination, simplifying the testing process.
With over 40 years of experience and strong relationships with trusted manufacturers, Allan Chemical Corporation ensures materials are accompanied by essential documentation, such as Certificates of Analysis and Safety Data Sheets. Their just-in-time delivery model ensures laboratories maintain a steady supply, reducing logistical challenges.
For labs navigating intricate compliance demands, collaborating with a dependable supplier like Allan Chemical Corporation eliminates a key uncertainty in impurity management.
Disclaimer: This content is for informational purposes only. Consult official regulations and qualified professionals before making sourcing or formulation decisions.
Conclusion
Key Takeaways
Trace impurity testing presents a range of technical hurdles. Achieving reliable results often hinges on managing sub-nanogram signal-to-noise ratios and addressing hidden coelution issues. As Adam Dickie, Ph.D., Science Communication Specialist, explains:
"Retention time alone does not confirm purity. A peak may appear well-resolved, yet hidden coelution can compromise accuracy." [12]
Complex sample matrices can obscure trace impurities or lead to inaccurate results, making robust sample preparation and thorough method validation essential for maintaining regulatory compliance.
These points underscore the intricate nature of trace impurity testing and highlight the precision required for accuracy.
Final Thoughts
Given these challenges, ongoing refinement of analytical methods is critical. Even small changes to chromatographic conditions can improve resolution and sensitivity without requiring a complete overhaul of the process.
The importance of using high-quality raw materials cannot be overstated. Starting with compendial-grade chemicals minimizes variability and enhances compliance. Impurities often originate in raw materials prior to synthesis, making sourcing decisions crucial. Allan Chemical Corporation provides compendial-grade chemicals – USP, FCC, ACS, and NF grades – backed by over four decades of experience. Their just-in-time delivery and detailed documentation, including Certificates of Analysis and Safety Data Sheets, support laboratories in maintaining consistency and reducing variability at the source.
Effective impurity testing rests on consistent method validation, properly maintained instrumentation, and high-quality raw materials – principles that remain central to achieving reliable and compliant results.
Disclaimer: This content is for informational purposes only. Consult official regulations and qualified professionals before making sourcing or formulation decisions.
FAQs
How can I improve signal-to-noise for trace impurities?
To improve the signal-to-noise ratio (SNR) in chromatography when detecting trace impurities, fine-tune detector settings such as the time constant and slit width. Routine system maintenance, including thorough washing and proper equilibration, reduces contamination and prevents ghost peaks. Choosing an appropriate column and using accurate calibration standards also play a key role in achieving cleaner signals and better impurity detection.
What’s the fastest way to confirm hidden coelution?
The fastest way to identify hidden coelution is by applying advanced chromatographic methods. Pay special attention to refining sample preparation, evaluating matrix effects, and utilizing automation tools. You might also explore alternative detection methods to reduce false positives and improve separation precision. These practices can lead to more dependable trace impurity detection and trustworthy outcomes.
How do I reduce matrix effects in LC-MS quantitation?
To reduce matrix effects in LC-MS quantitation, focus on refining sample preparation, chromatography, and measurement techniques. Start with selective sample cleanup methods to eliminate substances that could interfere with your analysis. Adjust chromatographic conditions to achieve effective separation of analytes from potential contaminants. Additionally, measuring multiple analyte-specific ions enhances selectivity and improves accuracy.
Keep a close eye on data quality metrics throughout the analysis. This practice helps identify and address any matrix interference, leading to more reliable and precise results.


Comments are closed