Yield stress is the minimum stress required to transition a material from solid-like to liquid-like behavior. It’s critical in industries like food production, construction, and 3D printing. However, measuring it accurately is complex and results can vary significantly depending on the method and sample handling. Key challenges include:
- Vane Technique Issues: Errors from improper vane geometry, alignment, or material settling.
- Stress Ramp Data Collection: Inconsistent yield points due to insufficient data density.
- Curve Fitting Problems: Variability caused by inappropriate mathematical models or incomplete data.
- Time-Dependent Behavior: Thixotropic materials require careful pre-shearing and equilibration.
- Temperature and Oscillatory Testing: Sample temperature discrepancies and unclear yield definitions.
Each method has trade-offs, so understanding your material’s properties and specific application needs is essential for reliable results.
Yield Stress, Oscillation Rheology and Phase Angle
sbb-itb-aa4586a
Problems with Vane Technique Measurements
The vane technique is commonly used to measure yield stress in concentrated suspensions like cement slurries, clay emulsions, and food products. However, errors in setup or improper handling of samples can lead to inaccurate results. While some consider it "a simple but accurate method for direct yield stress measurement" [4], the method’s accuracy is highly dependent on proper execution and the material’s response during testing.
Vane Geometry and Alignment Errors
The shape and dimensions of the vane tool play a critical role in obtaining accurate measurements. Studies indicate that using conical vanes or vanes with a low height-to-diameter (H/D) ratio can lead to inflated yield stress values [3]. This happens because the method assumes a uniform stress distribution across a cylindrical surface [4]. When the vane geometry deviates from this ideal shape, such as with a conical design or improper H/D ratio, the sheared surface becomes irregular, resulting in distorted readings.
To minimize these errors, it’s essential to use a vane with a standard H/D ratio and ensure the tool is vertically aligned before testing [3][4]. Even a slight misalignment of the vane shaft can disrupt the cylindrical shearing surface, throwing off the torque-to-stress calculation and leading to unreliable data. Additionally, the material’s reaction during the insertion of the vane must be carefully monitored to avoid compromising the results.
Material Settling During Measurement
Another challenge arises from the material’s behavior during vane insertion. Thixotropic materials, for instance, experience shear rejuvenation when the vane is inserted, which temporarily disrupts their microstructure [2]. This process competes with the natural aging of the material, and the timing of the measurement determines whether the test reflects static or dynamic yield stress.
For materials that tend to settle or exhibit time-dependent behavior, a standardized equilibration period after vane insertion can help restore the material’s microstructure, ensuring consistent results [2]. On the other hand, for materials that settle quickly, performing the measurement immediately after insertion may be necessary to capture the dynamic yield stress before significant structural changes occur. The choice of approach depends on whether the goal is to understand the material’s properties at rest or during flow.
Stress Ramp Method Data Collection Problems
While the vane method encounters issues with geometry and settling, the stress ramp method has its own set of challenges, particularly in collecting reliable data. This technique gradually increases stress to trigger material flow, but it often struggles to provide consistent results. A major issue lies in the lack of data density during the transition from solid to liquid, leading to incomplete yield point data. Adding to this complexity is the variability in how yield stress is defined.
As Professor Steven Abbott explains, "There is no such thing as ‘the’ yield stress" [6]. The results can differ greatly depending on the measurement method and the mathematical model used to interpret the data. This variability highlights the importance of gathering enough data points to accurately capture the transition, rather than relying on a single measurement that might miss the yield point altogether.
Data Sampling Requirements
Accurately identifying the yield point requires collecting sufficiently dense data throughout the stress ramp, especially in the region where the material transitions from elastic to plastic behavior. For materials with gradual transitions, widely spaced measurements can easily miss this critical point [5]. To address this, the rheometer’s sampling rate should be adjusted to capture more frequent data points during the expected yield region, ensuring a clearer and more detailed view of the transition.
For materials exhibiting viscoelastic properties before and after yielding, noise and gradual transitions can obscure the yield point [6][7]. In such cases, plotting the data on a log-log scale (log(σ) versus log(γ)) can help. This method identifies the yield stress as the intersection of two nearly straight lines, one representing the elastic region and the other the flow region [6]. This approach is particularly useful when linear plots fail to clearly reveal the transition.
Linear Region Evaluation Errors
Another challenge lies in pinpointing the elastic region with precision. This involves analyzing the material’s compliance (J = strain/stress) over time. Ideally, compliance remains steady until yielding begins, after which it increases [6]. However, many materials show a slight increase in compliance even before reaching the actual yield point, making it tricky to determine where elasticity ends and plasticity takes over.
When the transition isn’t sharply defined, operators can use a standardized "proof stress" method to determine the yield point consistently [7]. According to the UNSW School of Materials Science and Engineering, "It is often difficult to determine the exact point where yielding begins, so in practice a proof stress is used" [7]. A common approach is the 0.2% strain offset, where the yield stress corresponds to the stress level at 0.2% permanent strain. This method removes subjectivity and ensures reproducible results across different operators and testing conditions.
This content is for informational purposes only. Consult official regulations and qualified professionals before making sourcing or formulation decisions.
Flow Curve Extrapolation and Curve Fitting Problems
Accurate yield stress measurement depends heavily on reducing experimental errors and selecting the right mathematical model. Extrapolating flow curve data to zero shear rate might seem straightforward, but it often leads to imprecise yield stress estimates, with results varying by more than tenfold. As highlighted by the Anton Paar Wiki:
"The yield value determined by whatever means is not a material constant because it depends on the sample’s pretreatment and on the measuring method used, as well as on the evaluation method used" [8].
This variability underscores how much the choice of model influences the final yield stress value.
For thixotropic materials – those whose structure changes under shear – the challenge is even greater. Using the Herschel-Bulkley model, for instance, may yield different results depending on whether the measurement captures static or dynamic yield stress, which is influenced by the testing sweep [2]. Even small differences in testing procedures can lead to significant variations in yield stress, even with identical equipment.
Data Requirements for Curve Fitting
To extrapolate flow curves reliably, capturing accurate data at the lowest shear rates is essential [2]. However, reaching these low shear rates often requires extended equilibration times to achieve a true steady state. Without sufficient equilibration, the data may be incomplete or misleading. Depending on the material, these tests can take anywhere from minutes to several hours.
Improving accuracy involves focusing on the transition region by including more measurement points. Visualizing this data on a logarithmic scale can make the yield point easier to identify. Additionally, controlled shear stress (CSS) testing can offer better precision by directly measuring the balance between internal cohesion and external forces [8].
Once accurate low shear data is collected, the next hurdle is selecting the most suitable curve fitting model.
Bridging Effects in Measurement Gaps
The curve fitting model chosen can significantly impact the yield stress determination. For example, the Bingham model, which assumes a linear relationship (τ = τ_B + η_B · γ̇), often fails to capture the non-linear behavior of materials at low shear rates [8]. On the other hand, the Casson model uses a square-root function to better represent the curvature at low rates. Among these, the Herschel-Bulkley model tends to provide the best fit by incorporating a power-law parameter, which accounts for shear-thinning or shear-thickening behavior [8].
For non-thixotropic fluids, consistency can be verified by comparing Herschel-Bulkley fits with results from oscillatory stress-strain tests [2]. When extrapolation becomes overly complex or time-intensive, researchers sometimes adopt a practical approach by using a very low shear rate – such as 0.01 s⁻¹ – as a standard reference to approximate the material’s resting state [8].
Balancing these curve fitting decisions with other testing protocols is key to ensuring reliable measurements.
This content is for informational purposes only. Consult official regulations and qualified professionals before making sourcing or formulation decisions.
Time-Dependent Material Behavior and Testing Protocols
The way materials behave over time plays a critical role in measuring yield stress. For simple systems, viscosity is influenced solely by shear rate. However, in thixotropic systems, it also depends on the material’s deformation history. This means that the measured yield stress can differ significantly – sometimes by more than tenfold – depending on how the sample is handled and the testing method used [2].
Thixotropic materials experience two opposing processes: aging (where the microstructure builds up over time) and shear rejuvenation (where the microstructure breaks down due to flow). As Morton M. Denn and Daniel Bonn explain:
"For thixotropic yield stress materials the viscosity depends not only on the shear rate but also on the (deformation) history of the sample, implying that for this type of material the rheological behavior is given by a competition between aging – spontaneous build-up of some microstructure – and shear rejuvenation – breakdown of the microstructure by flow" [2].
This interplay results in two distinct yield stresses: a higher static yield stress and a lower dynamic yield stress. These differences highlight the importance of designing testing protocols that can accurately capture these variations.
Settling vs. Equilibrating Materials
One key challenge is determining whether a material requires immediate testing or a stabilization period before measurement. For materials that settle quickly, rapid testing is essential to capture the yield point before significant changes occur [2]. On the other hand, thixotropic materials need a controlled rest period to allow their microstructure to age.
To obtain consistent results, it’s crucial to use a standardized pre-shearing step, as described earlier, to reset the material’s microstructure [2]. After pre-shearing, allow the material to rest for a set amount of time – ranging from minutes to hours, depending on its properties – to ensure uniform aging. Examples of thixotropic yield stress materials include fresh cement pastes, drilling muds, clays, paints, inks, and certain food products like yogurt or gelatin [9].
Determining Measurement Windows
Selecting the right measurement window is essential for reliable yield stress results. At low shear rates, reaching a true steady state can take a long time, as equilibrium times increase as shear rates decrease. To address this, testing protocols should include standardized rest periods after loading the sample to ensure consistent microstructural aging. During shear rate sweeps, monitor stress to confirm when steady state is achieved.
Additionally, clearly define how the yield point is determined. It could represent the point where linear behavior ends, the maximum stress overshoot, or the final steady-state value. For dynamic yield stress, decreasing shear rate sweeps are typically used. Conversely, static yield stress is often measured using increasing sweeps or stress-growth experiments [2].
This content is for informational purposes only. Consult official regulations and qualified professionals before making sourcing or formulation decisions.
Temperature and Oscillatory Testing Factors
When it comes to measuring yield stress, temperature control and oscillatory testing methods introduce their own challenges. Interlaboratory studies have shown variations of up to 40% in zero-shear rate viscosity measurements [10]. Managing these variables effectively is key to ensuring consistent and reliable data.
Addressing Temperature Variability
Precise temperature control is critical to avoid inaccuracies in yield stress measurements. One common issue in rheometry is the difference between the instrument’s "set temperature" and the actual "sample temperature" within the shear gap [10]. This discrepancy can lead to significant errors, as the set temperature does not always reflect the true conditions of the sample.
High shear rates can generate heat, reducing viscosity and skewing yield stress values [10]. In plate-plate geometries, thermal expansion of the sample can alter the gap distance during temperature-dependent tests, further complicating measurements. Adjusting the gap to account for this expansion is essential [10]. Additionally, storing samples under stable temperature, humidity, and lighting conditions helps prevent unwanted plasticizing effects [10].
To address these challenges, temperature calibration is crucial. Instead of relying solely on automated sensors, use specific calibration techniques to determine the true sample temperature for a given set temperature [10]. Errors in rotational rheometers typically range from 1% to 10%, and these temperature-related issues directly influence oscillatory measurement outcomes [10].
Oscillatory Testing and Yield Stress
Oscillatory testing methods, such as amplitude sweeps at a constant frequency, help determine the linear viscoelastic (LVE) range [10]. The LVE limit is usually identified when the moduli deviate by more than 5% from their small-amplitude plateaus [10]. As noted in the IUPAC Technical Report:
"The limit of linear viscoelasticity shows up as a decrease of the moduli with increasing amplitude. Typically, the limit is first observed for G’" [10].
Defining the exact yield point from oscillatory data remains a topic of debate. Some researchers pinpoint the yield point where the storage modulus (G’) begins to drop, while others prefer the G’/G” crossover point, marking the transition from elastic-dominant to viscous-dominant behavior. A more nuanced approach considers a "yield zone", acknowledging that the shift from solid-like to liquid-like behavior occurs over a range of stresses rather than at a single value [11]. As Kyu Hyun et al. highlighted in Progress in Polymer Science:
"Nonlinear viscoelastic characterization will provide much more insight for distinguishing such structural differences" [11].
This information is intended for educational purposes. Always consult official regulations and qualified professionals before making sourcing or formulation decisions.
Choosing the Right Measurement Method
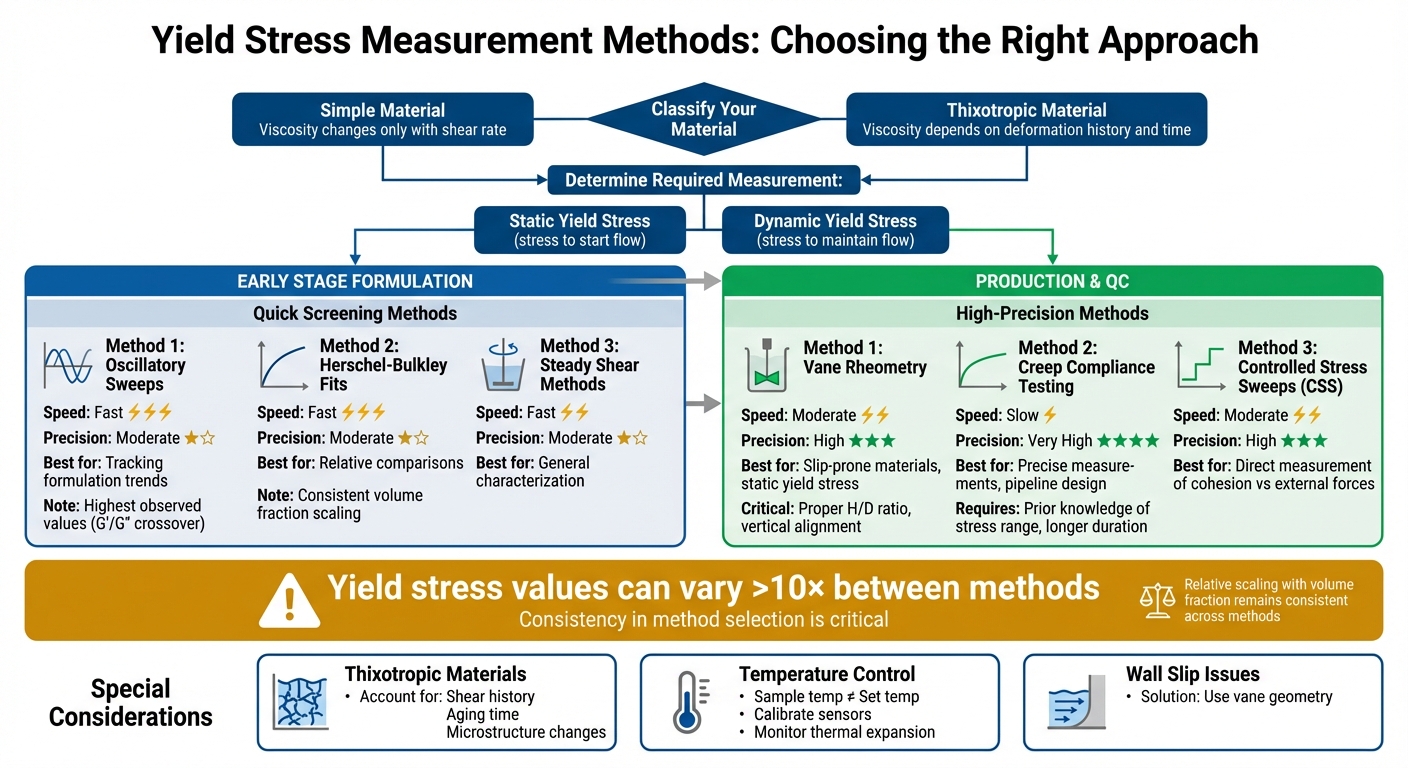
Yield Stress Measurement Methods Comparison: Accuracy vs Practicality
Selecting the right measurement method is a crucial step when working with materials, especially since yield stress values can vary significantly depending on the technique and how the sample is handled[2]. No single approach fits all situations, so understanding the trade-offs between accuracy and practicality is key.
Start by determining whether your material is "simple" (its viscosity changes only with shear rate) or "thixotropic" (its viscosity is influenced by deformation history and time)[2]. Then, identify whether your application requires measuring static yield stress (the stress needed to start flow) or dynamic yield stress (the stress needed to maintain flow)[2].
Precision vs. Practicality in Method Selection
Once you’ve classified your material, the next step is to choose a method that balances precision with practicality. For precise yield stress measurements, creep compliance testing is a reliable option. However, it requires prior knowledge of the expected stress range and involves longer test durations, making it less convenient for quick assessments[2]. If your material is prone to wall slip, using vane geometry can help minimize errors[1].
For faster, more practical measurements during early formulation stages, oscillatory sweeps or steady shear methods work well. Oscillatory testing, which identifies yield stress using the G’/G” crossover point, often provides the highest observed values[2]. While these methods may seem somewhat arbitrary, consistency in their application is critical. An added benefit is that, even though absolute yield stress values can vary between methods, the relative scaling of yield stress with the volume fraction of the dispersed phase remains consistent[2]. This makes simpler methods effective for tracking formulation trends without requiring highly detailed testing at every step.
Adjusting Measurement Techniques Over Project Lifecycles
As a project progresses, measurement techniques need to evolve to meet changing demands. During early-stage formulation, quick screening methods like oscillatory sweeps or Herschel–Bulkley fits are ideal for tracking yield stress trends efficiently. These methods leverage the consistent relationship between volume fraction and yield stress, offering meaningful insights without the need for exhaustive testing[2].
When moving into production engineering and quality control, more precise measurements become essential. For instance, pipeline design calculations rely on accurate static yield stress values to determine the minimum pressure required to restart flow[2]. At this stage, switching to methods like vane rheometry for slip-prone materials or creep testing for high-precision needs ensures safe and efficient operations. Additionally, if your material develops thixotropic behavior during scale-up, you’ll need to account for time-dependent structural changes and shear history in your testing protocols[2]. Adapting your measurement approach throughout the project lifecycle ensures accuracy and reliability, even as material properties and testing requirements evolve.
This content is for informational purposes only. Consult official regulations and qualified professionals before making sourcing or formulation decisions.
Conclusion
Yield stress measurements can differ dramatically – sometimes by more than tenfold – due to variations in testing methods and sample handling [2]. To obtain dependable results, it’s essential to select a technique that aligns with your material type and application.
For simpler materials, static and dynamic yield stress values tend to remain consistent. However, thixotropic materials, which are sensitive to shear history and microstructure aging, can show significant variability [2]. Factors like temperature control and choosing the right geometry are equally important for reducing errors. For instance, using a vane device can help avoid wall slip [1], and adhering to standardized definitions of yield points improves reproducibility.
As noted by Morton M. Denn and Daniel Bonn:
"the differences between the various methods are significant; on the other hand, the scaling of the measured yield stress with the volume fraction of dispersed phase shows the same dependence independently of the way in which the yield stress is obtained experimentally" [2].
This highlights that while absolute yield stress values are method-dependent, consistent use of a single approach can reveal meaningful trends in formulation.
To ensure reliable data, tailor your testing strategy to the specific requirements of your project. Early-stage formulations may call for rapid screening methods, while production engineering often benefits from precise techniques like vane rheometry. Key considerations include maintaining consistent testing conditions, accounting for time-dependent material behavior, and selecting appropriate measurement windows. These steps help minimize errors and provide valuable insights for formulation, design, and quality control.
At Allan Chemical Corporation, we understand the critical role rigorous testing protocols play in delivering consistent, high-quality products. With decades of experience in regulated industries, we prioritize robust methodologies to support your success.
This content is for informational purposes only. Consult official regulations and qualified professionals before making sourcing or formulation decisions.
FAQs
What steps can I take to reduce errors when measuring yield stress with the vane technique?
To get precise yield stress measurements with the vane technique, paying attention to a few key details can make all the difference. Start with the right vane size and shape. Variations, such as conical designs or improper height-to-diameter ratios, can throw off your results. Also, make sure the sample is prepared and loaded carefully – air bubbles or inconsistent filling can lead to inaccuracies.
Another factor to watch for is wall slip. Proper sample preparation and handling can help minimize this issue. Use a shear rate that fits your test requirements, and perform multiple measurements to ensure consistent results. Finally, keep your equipment calibrated and stick to standardized procedures to improve reliability and reduce the chances of errors.
What should I consider when deciding between static and dynamic yield stress measurements?
When choosing between static and dynamic yield stress measurements, it’s essential to think about how the material behaves and how you plan to use the data. Static yield stress reflects the stress required to get a material moving from rest, which makes it well-suited for tasks like pouring or dispensing. In contrast, dynamic yield stress focuses on how a material flows once it’s already in motion, making it more applicable for continuous processes or manufacturing.
Several factors can influence the results, including sample history, temperature, and the specific measurement techniques used. Static measurements typically involve methods like stress ramp or creep tests, while dynamic measurements often use oscillatory or rotational rheometry. Additionally, time-sensitive properties such as thixotropy (where viscosity decreases with sustained shear) or aging (changes in structure over time) can have different effects on these measurements. By understanding your material’s unique characteristics and the demands of your application, you can select the method that delivers the most dependable and relevant results.
How does temperature influence yield stress measurements?
Temperature significantly influences yield stress measurements because it directly impacts a material’s internal structure and how it flows. When the temperature rises, the material’s thermal energy increases, often weakening its structure and lowering the stress needed to initiate flow. On the flip side, at cooler temperatures, materials tend to become more rigid, requiring higher stress to start flowing.
Maintaining stable temperature conditions during testing is crucial for reliable results. Even minor temperature shifts can change a material’s properties, potentially leading to inconsistent data. By strictly controlling temperature settings and adhering to standardized testing protocols, you can ensure more accurate and repeatable yield stress measurements.


Comments are closed